Table of Contents
The Real Cost of Inventory Mismanagement
Inventory is the largest asset on many small business balance sheets. And the most mismanaged. The two failure modes are mirror images: too much inventory ties up cash, generates carrying costs, and eventually becomes dead stock. Too little inventory causes stockouts, lost sales, and damaged customer relationships. Both are expensive. The businesses that handle inventory well treat it as a cash management problem, not just a logistics problem.
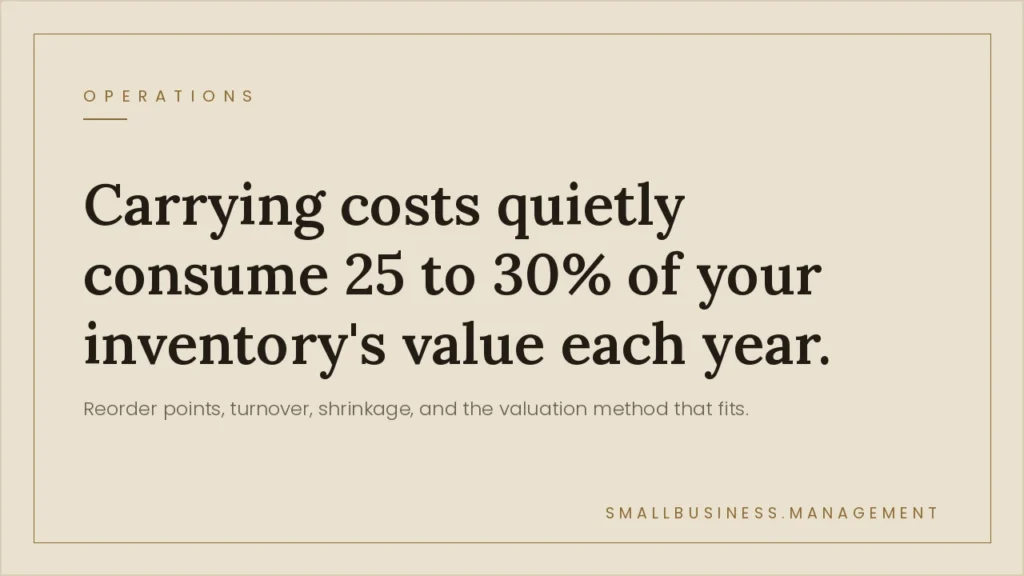
Most small businesses underestimate carrying costs because they only count the obvious ones. Rent on warehouse space and the cost of the goods themselves. The full carrying cost picture includes insurance, shrinkage, obsolescence risk, financing cost on capital tied up. The labor to manage and count it. When all of these are included, carrying cost typically runs 25–30% of average inventory value per year. A business holding $200,000 in average inventory is spending $50,000–$60,000 per year just to hold it.
Inventory Valuation Methods: Which One Is Right for Your Business
| Method | How it works | Best for | Tax impact | Key tradeoff |
|---|---|---|---|---|
| FIFO | Oldest stock sold first | Perishables, fashion, dated goods | Higher profit (lower COGS) in inflation | Accurate balance sheet. Higher tax bill when prices rise |
| LIFO | Newest stock sold first | Non-perishables, commodities | Lower profit (higher COGS) in inflation | Tax savings in inflation. Not IFRS-permitted |
| Weighted average | Average cost per unit across all purchases | Fungible goods (nuts, bolts, liquids) | Blended. Between FIFO and LIFO | Smooths price fluctuations. Less precise |
| Specific identification | Each unit tracked at its actual cost | High-value, unique items (jewelry, vehicles) | Matches exactly | Most accurate. Impractical at scale |
| Just-in-time (JIT) | Order to meet demand, not to stock | Made-to-order, low-storage businesses | Minimal inventory on books | Requires reliable suppliers. Any disruption causes stockouts |
Building an Inventory System That Works: 5 Steps
- Classify your inventory using ABC analysis. Divide inventory into three buckets: A items (top 20% of SKUs generating 80% of revenue, count these weekly, monitor closely), B items (mid-tier by revenue, monthly count), C items (long tail, low velocity: quarterly count). ABC analysis focuses your attention where the money is, not where the volume is.
- Set reorder points and safety stock for every A and B item. Reorder point = (average daily usage × lead time in days) + safety stock. Safety stock = buffer against demand spikes and supplier delays. Running out of an A item while waiting for a reorder is a preventable revenue loss: set the math and automate the trigger.
- Implement cycle counting instead of annual physical counts. Annual inventory counts are disruptive and introduce a full year of error. Cycle counting, counting a fraction of inventory every week on a rotating schedule, spreads the work, catches errors early, and eliminates the year-end count scramble. Count your A items monthly, B items quarterly, C items annually.
- Connect your inventory system to your point-of-sale or order management. Manual inventory tracking fails the moment the business gets past a handful of SKUs. Every sale, return, and receipt should update inventory counts in real time. Tools at every budget level (Lightspeed, QuickBooks Commerce, Cin7, even Shopify’s built-in inventory) handle this without requiring manual entry.
- Review inventory turns quarterly and act on the outliers. Inventory turnover = COGS ÷ average inventory. A turn ratio below your industry benchmark signals overstock. Significantly above it may signal stockout risk. Review the slowest-moving 20% of SKUs quarterly and decide: mark down, bundle, return to supplier, or write off. Inaction on slow movers compounds the carrying cost problem.
Managing cash flow around your inventory investment?


